One Year of Solar Tracking
Solar Tracking on Habitat home in Broadway, VA
From Feb 2021 to April 2022, GiveSolar tracked solar energy production and cost savings on a Habitat for Humanity home in Broadway, VA. This table shows a one-year snapshot of energy production and savings. The average electricity cost was $0.1127/kWh. As electricity prices in Virginia rise by 3% annually, Habitat families with solar will see increased savings.
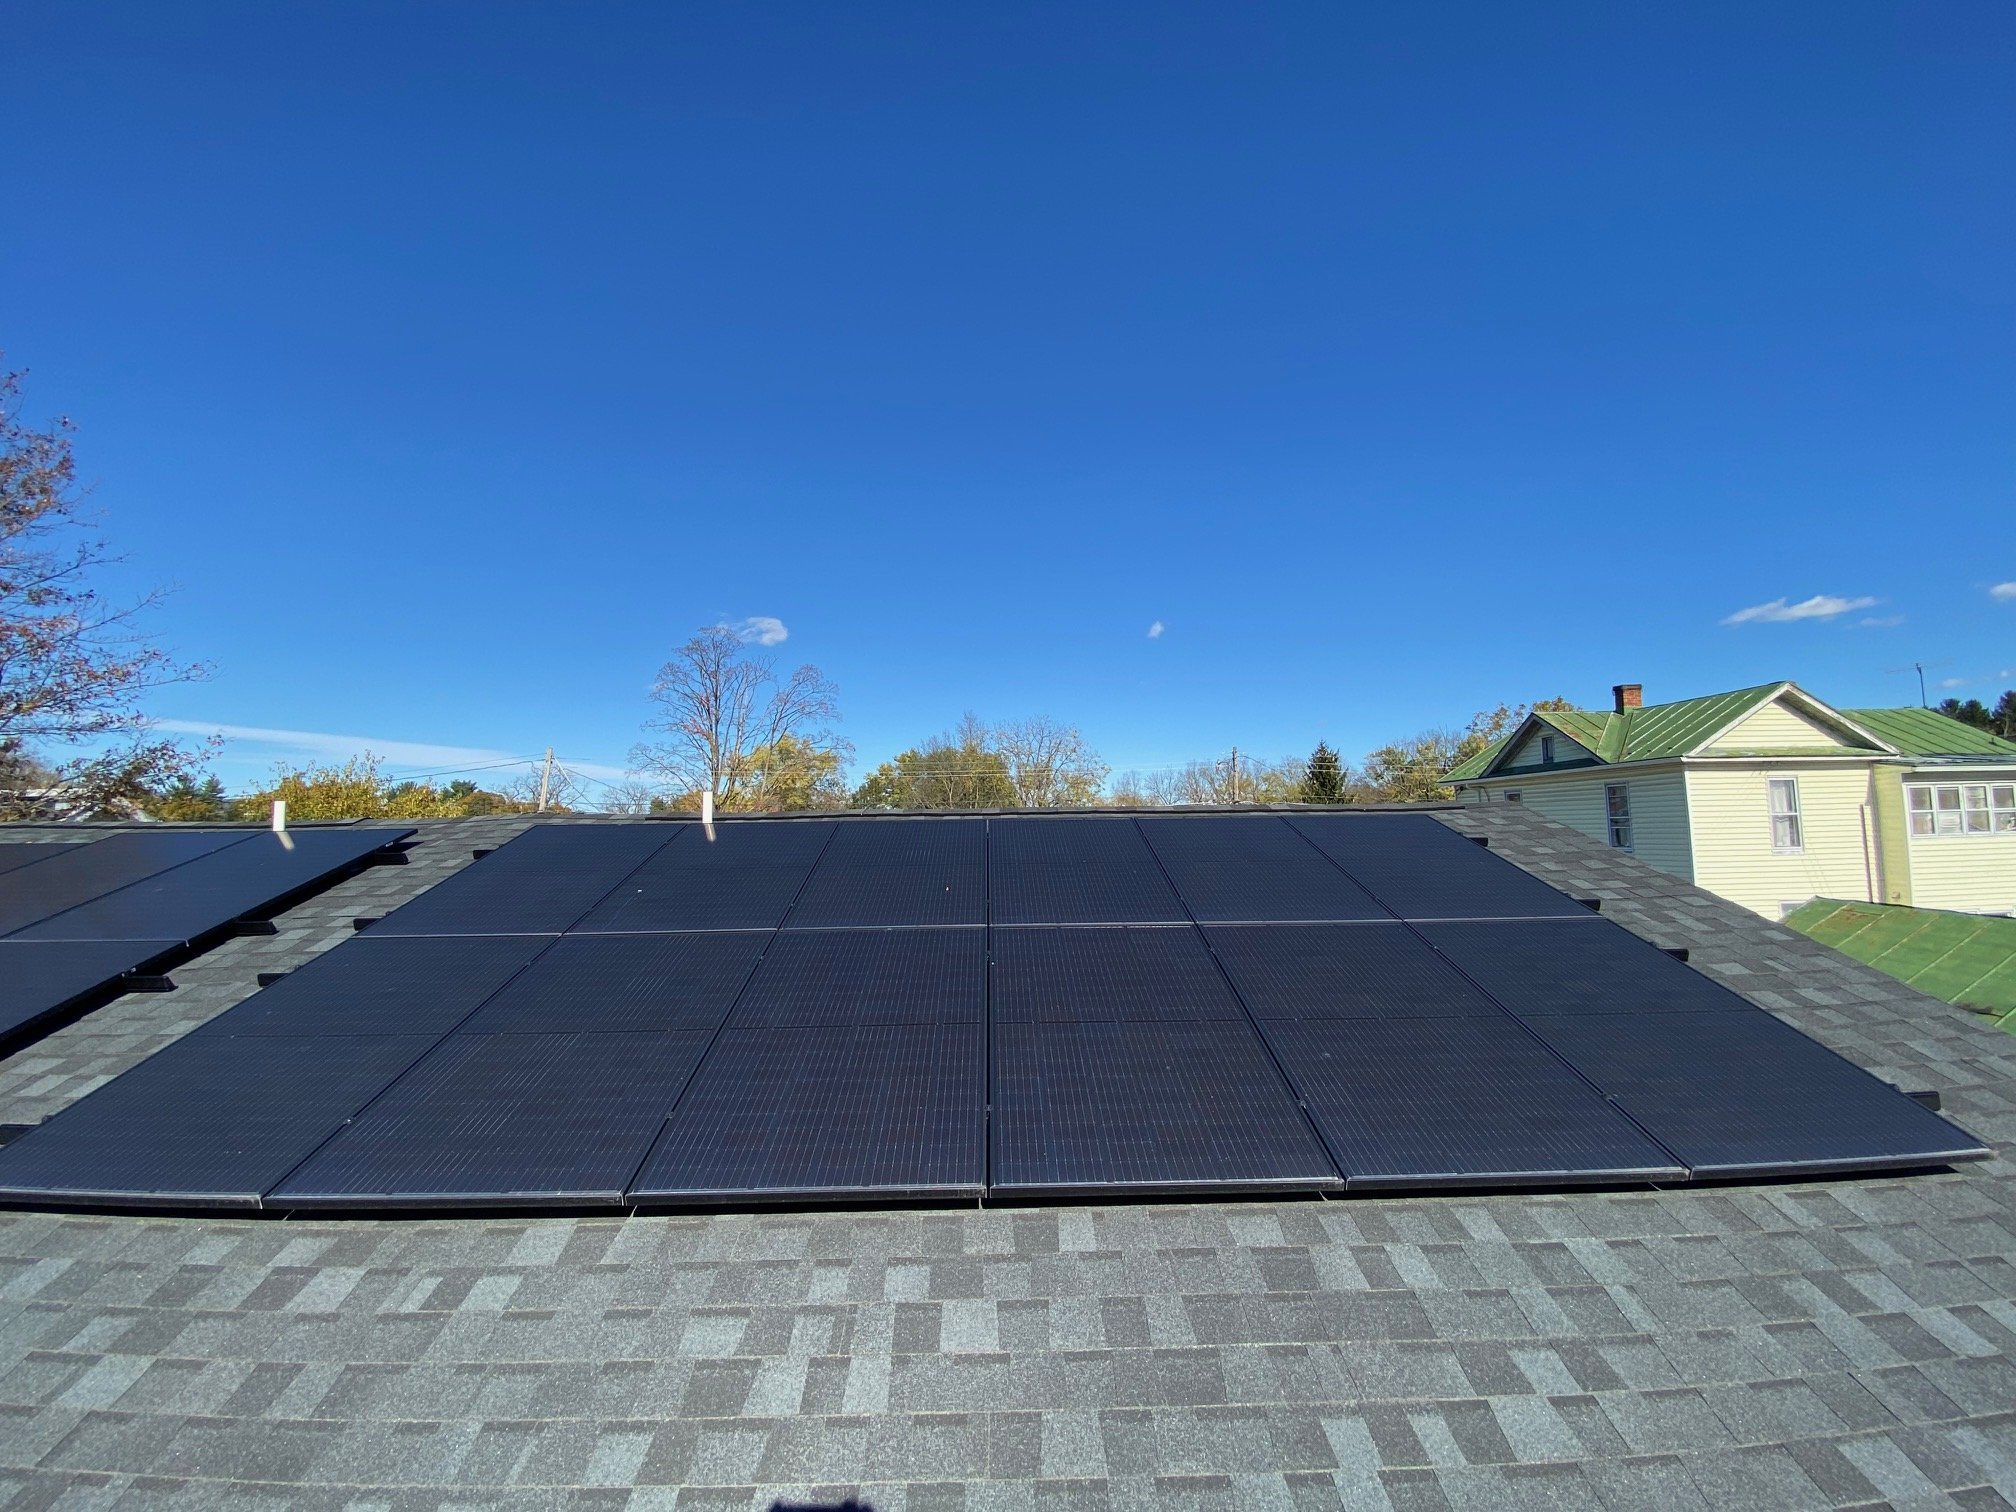
Solar system on Habitat home in Broadway, VA.
Solar System Information
Panels: 12 @ 315 Watts = 3.78 kW
Electricity Cost: $.1127 / kWh
Azimuth: 199.561
Commissioning: April 22, 2021
Roof pitch: 18.4 degrees
Finished sq. footage of home: 1200
*Projected monthly savings in 2030 for this home is $64.77 (assuming 3.5% annual rise in electric rates)
**Projected monthly average with a 5 kW system
Example Electric Bill #1: One Year of Solar
This electricity bill from a Habitat solar homeowner shows the seasonal impact on solar energy production and electricity use. Solar systems perform best from April to September, while winter months see higher usage and modest bills due to less sunlight. Homeowners can minimize electric bills year-round by being mindful of energy use, with some banking summer credits to offset winter costs. The bill also details usage, fuel cost adjustments, taxes, and the minimum charge.
Example Electric Bill #2: After Installing Solar
This example shows a Habitat homeowner’s electric bill after installing solar on April 22, 2021. The bill was as low as $7.63 (minimum charge) for several months. A well-designed 5 kW solar system (12 panels) can save about $60-$70 monthly.
Key points:
Solar homeowners won’t achieve a $0 bill due to the basic utility grid connection fee ($7.63 here).
Solar production and electricity use vary seasonally, with higher production in spring to fall and lower in winter.
Expect higher bills in winter due to increased heating demands and reduced solar output.
Residential Investment Tax Credit (ITC)
The ITC is a tax credit that can be claimed against federal income taxes owed and reduce the cost of your solar system by 30%.
Overview
The federal tax code offers incentives for renewable energy investments. These incentives lower out-of-pocket costs, tax obligations, and the payback period, making solar investments more appealing. Homeowners can reduce long-term energy costs by using the ITC and other solar incentives.
What is a tax credit?
A tax credit reduces the amount of income tax you owe. The federal residential solar energy credit allows homeowners to claim 30% of their solar system cost against federal taxes. For example, a $12,000 system reduces taxes by $3,600, lowering the net cost to $8,400. These savings are in addition to reduced or eliminated electricity costs and earnings from selling Solar Renewable Energy Credits (SRECs).
Additional information regarding SRECS can be found here.
How to claim the Federal Solar ITCs
This tax credit isn't fully refundable; if you lack enough tax liability, any unused credit can be carried forward to the next year.
Other incentives may include:
Utility rebates for solar installation
State government rebates
State tax credits
Some energy efficiency incentives have income thresholds. Check for current info.
Disclaimer: The solar tax credit and other incentives can change yearly. Consult a tax professional for advice on applying the ITC or other incentives. This information is not professional tax or investment advice.


